Open a new account
Account Login
From this article you will learn:
The MACD indicator is one of the most popular oscillators used by traders on both forex and other
financial markets for more than 40 years. It was designed for identifying current market trend and
accurate trading signals for entering a position. The MACD is still part of the standard toolset of all
trading platforms and services.
The name MACD is an abbreviation for Moving Average Convergence/Divergence. Traders usually pronounce it
as “macdee”.
The MACD is very often called a trend oscillator because it combines the properties of the two types of
price filters, trend indicator and oscillator.
The indicator’s purpose is to simplify the visualization of the signals provided by moving averages, to
decrease their intrinsic lag, and to fix other drawbacks typical for trend indicators.
The MACD oscillator is presented in a separate window located in the lower part of an asset’s price
chart. The indicator’s author, famous New York trader Gerald Appel, originally suggested displaying the
MACD as the two moving averages (fast and slow) and to view their crossover as a trading signal.
Over time, one of the moving averages was replaced by a histogram – bars oscillating along the zero
level. The indicator’s modern version looks like this:
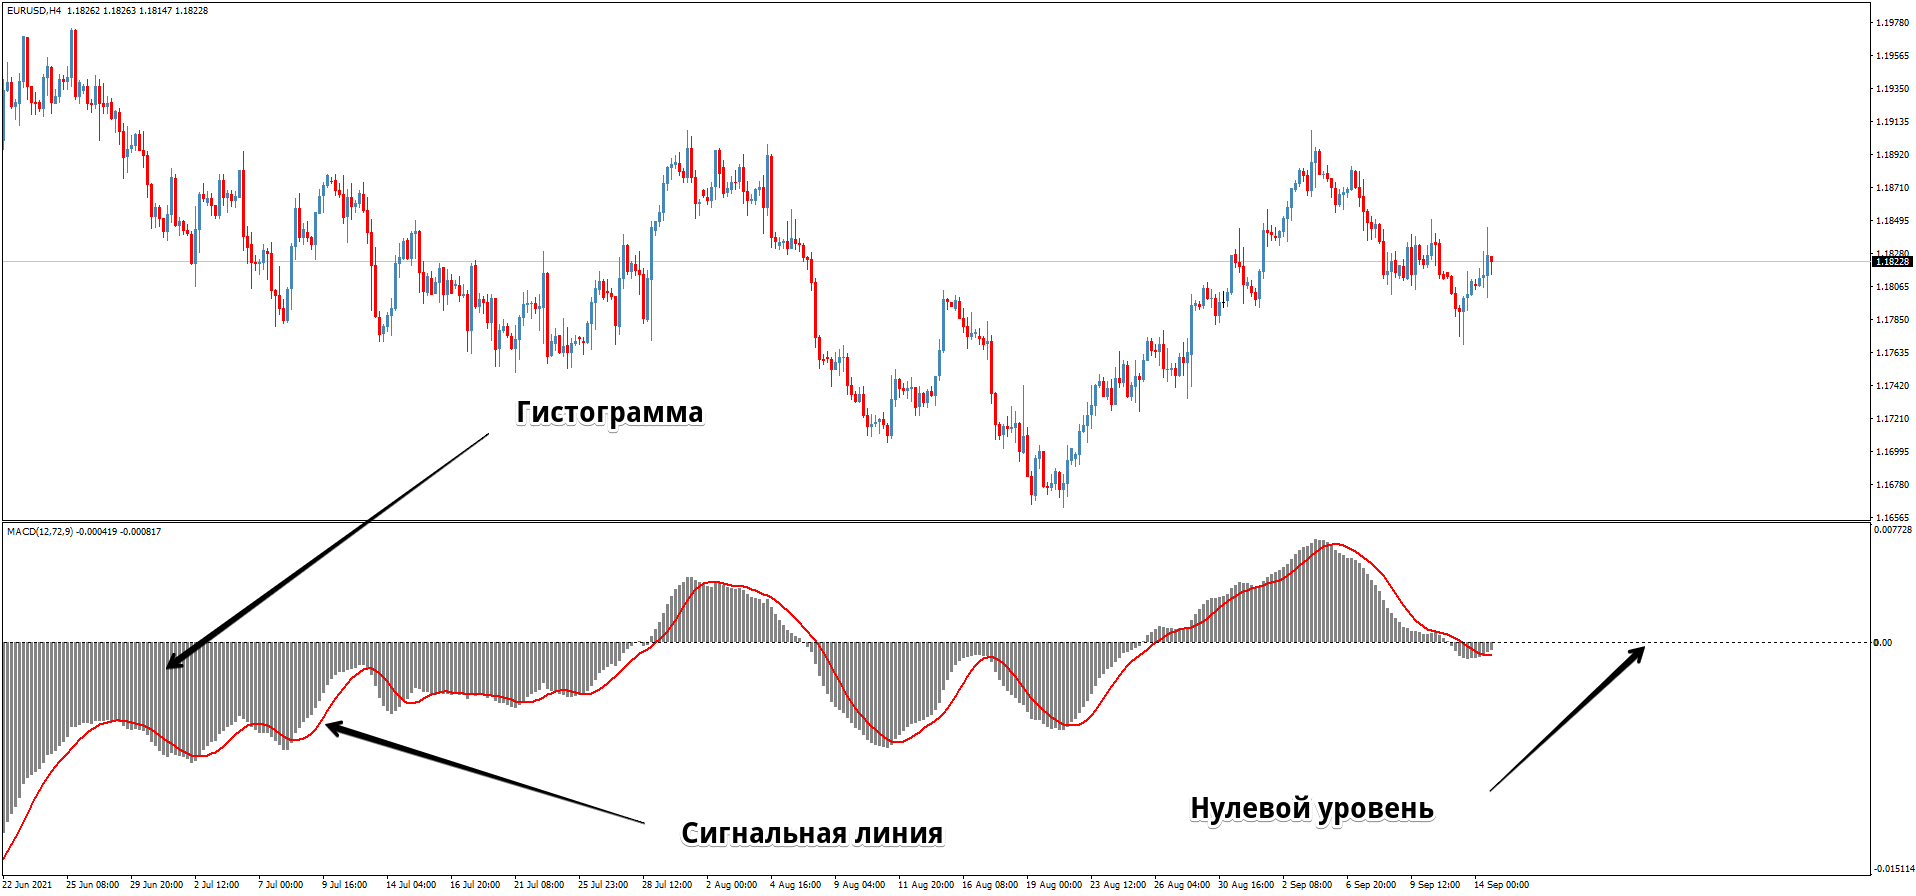
[Histogram; Signal line; Zero level]
Figure 1. The MACD indicator components
The MACD histogram is the difference between the fast and slow moving averages:
That is, the histogram’s rise indicates the uptrend while its fall indicates the downtrend.
Besides the histogram, the MACD has a signal line that allows getting additional trading signals; for
example, its crossover with the histogram is interpreted by some traders as a possible start of a new
trend.
To calculate the MACD indicator histogram, the two exponential moving averages are used:
MACD = EMA (CLOSE, PL) – EMA (CLOSE, PS), where
The result is the line of the original indicator that is now represented with the histogram. For this
reason the histogram is still called the fast line.
The MACD signal line is a simple moving average, but it’s calculated using the difference of the two
EMAs described above:
Signal = SMA (MACD, Pa), where
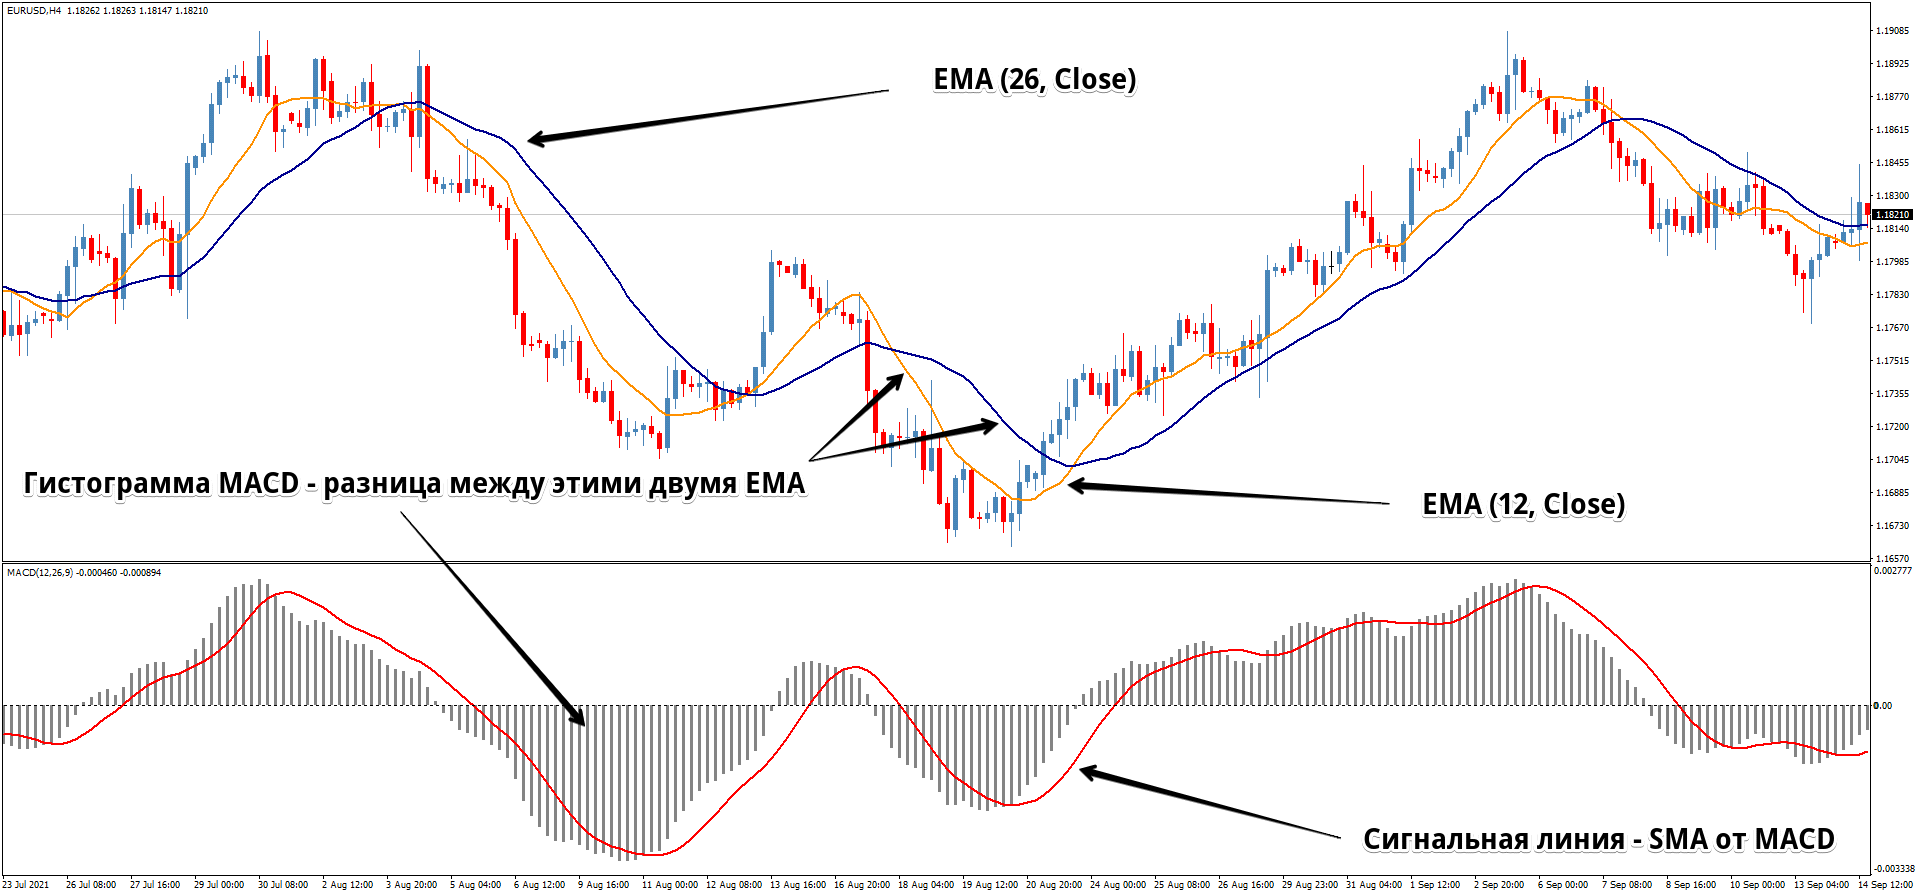
[The MACD histogram – difference between these two EMAs; Signal line – SMA of the MACD]
Figure 2. Calculating the MACD indicator
The MACD indicator has four major parameters to set up:
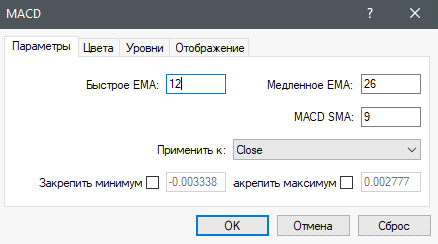
| Parameters | Colors | Levels | Display |
|---|---|---|---|
| Fast EMA: 12 | Slow EMA: 26 | ||
| MACD SMA: 9 | |||
| Apply to: | Close | ||
| Fix minimum | Fix maximum | ||
| ОК | Cancel | Reset |
Figure 3. Setting up the MACD indicator
It is recommended to set up the indicator for each asset separately. Since the MACD is based on moving
averages, the smaller their period, the more sensitive the indicator and the more false signals would be
generated. And when the period of moving averages increases, the MACD is “smoother” and there’s a
possibility of a trading signal lag.
Gerald Appel himself suggested using the following moving average periods:
These values were suggested for stock market trading, however they can also be used for other assets.
It’s also worth experimenting and finding individual parameters for your specific asset and timeframe.
The parameters found in the other tabs allow setting up color display of the MACD elements as well as
adding additional levels if it’s required by the algorithm of a specific trading strategy.
The MACD indicator demonstrates the highest efficiency on markets with a wide range of price
fluctuations.
When a market has a steady trend, the MACD allows getting precise entry points. Besides, in a narrow
range the indicator would give significantly less false signals when compared to other trend indicators
like Bollinger Bands and Parabolic SAR.
It is recommended to apply the MACD to timeframes of H1 and above.
Trading with this indicator is based on the following signals:
The crossover of the fast line (the MACD histogram) and the signal line is considered the major signal of this indicator:
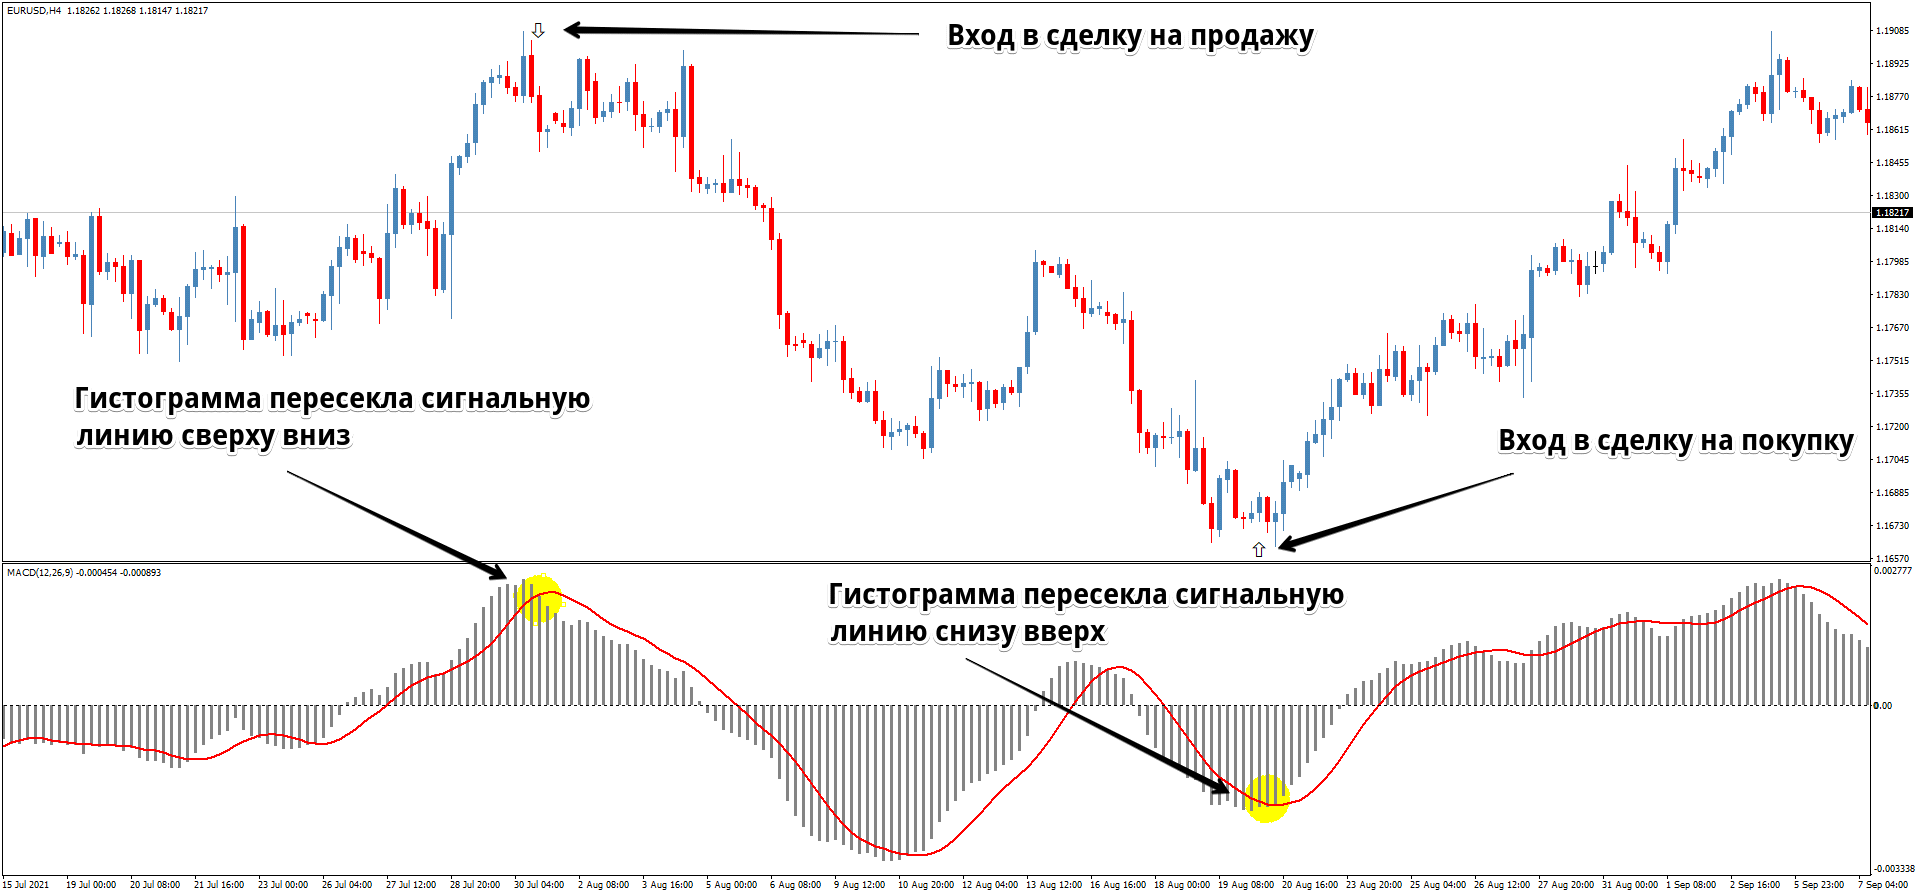
[Entering a buy trade;
Histogram crosses the signal line from above; Histogram crosses the signal line from below; Entering a
sell trade]
Figure 4. Line crossover signals
The efficiency of such MACD signals is significantly higher when the trades based on them are opened in the trend direction for a larger timeframe.
Oscillator Signals
As with other oscillators, one can use the MACD indicator lows and highs as signals. To this end one
sets up additional levels that would indicate overbought and oversold zones.
In this case the MACD indicator provides the following signals:
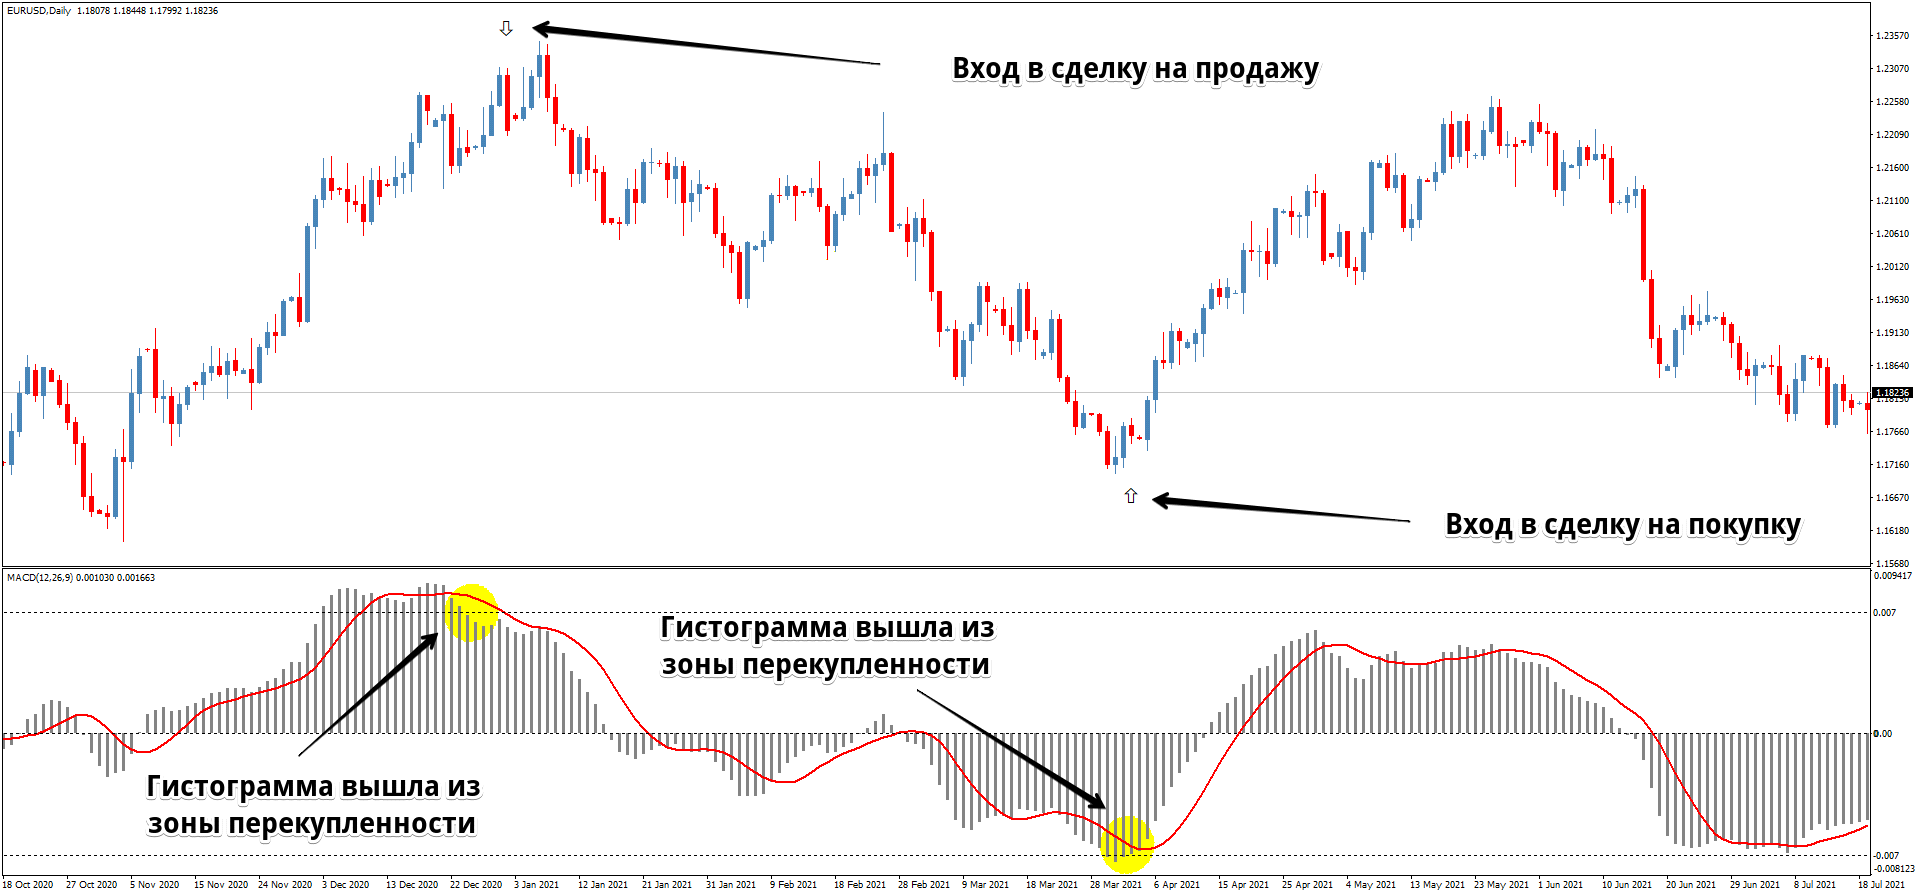
[Entering a sell trade;
Entering a buy trade;
Histogram leaves the oversold zone; Histogram leaves the overbought zone]
Figure 5. Using the oscillator signals
It should be noted that this type of signals is rarely used on its own, but it’s quite efficient when confirmed by trend indicators and other oscillators like Stochastic.
Divergences are the strongest MACD indicator signal. Moreover, experienced traders believe that the MACD
divergences are the most accurate ones.
Classical divergences imply:
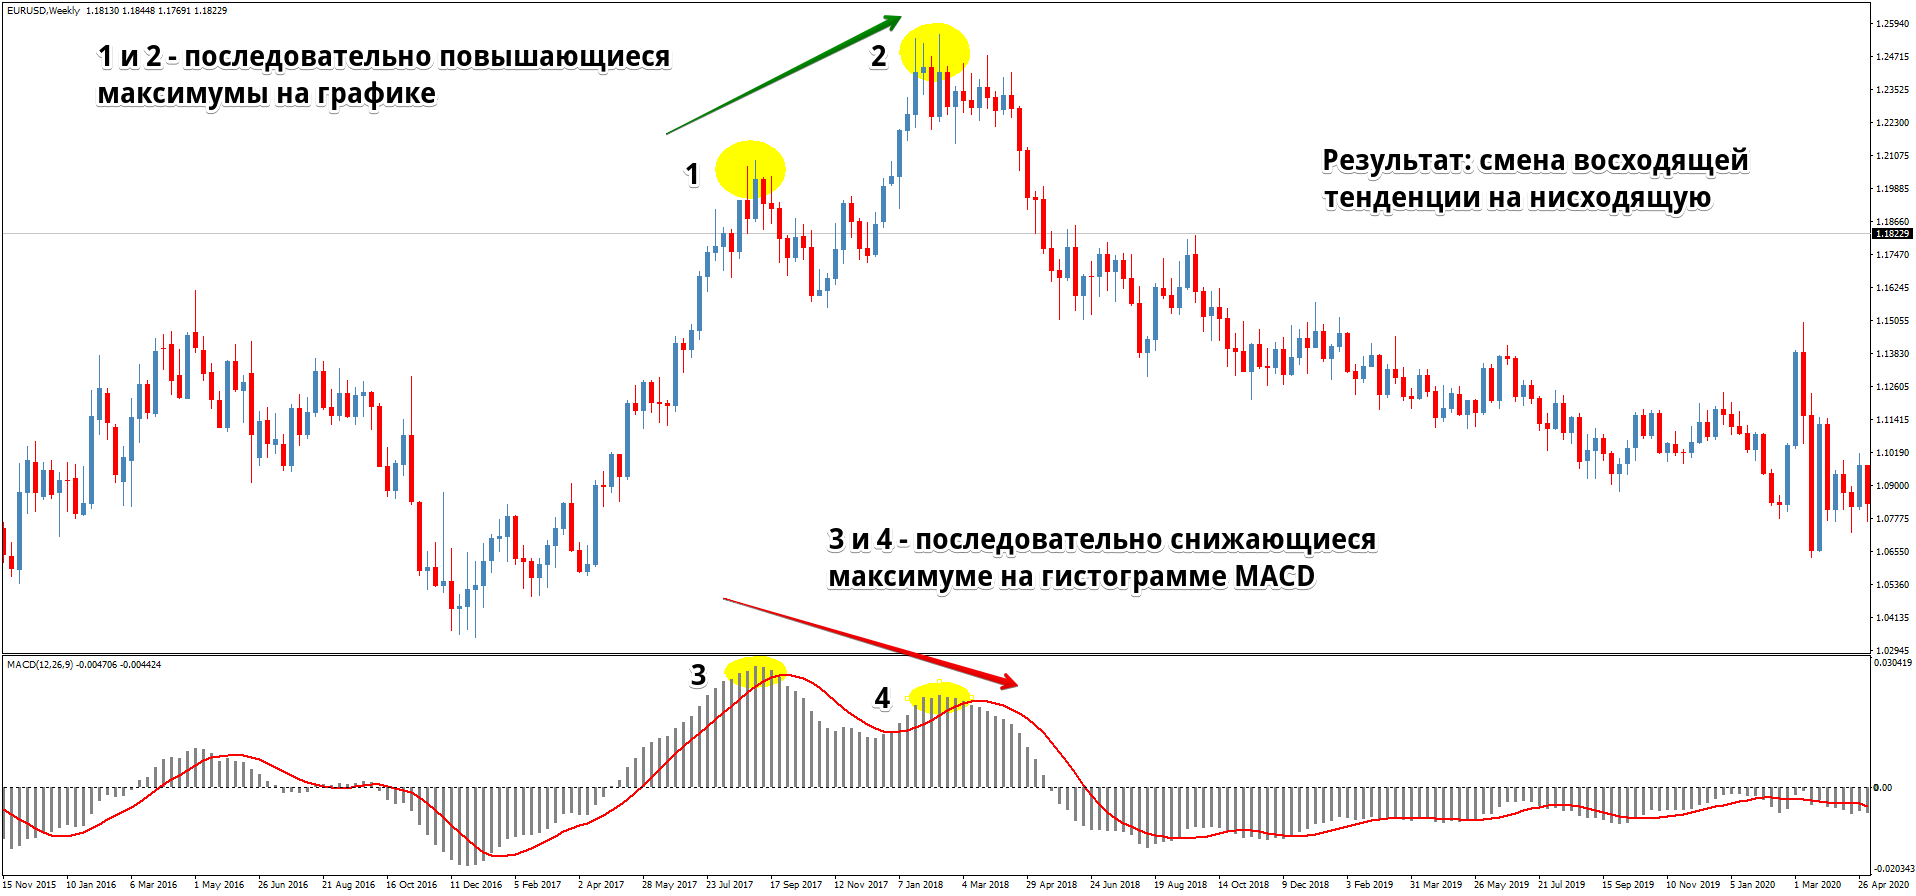
[1 and 2 are progressively higher highs on the chart; Result: the uptrend turns into the downtrend;
3 and 4 are progressively lower highs of the MACD histogram]
Figure 6. Using the MACD divergence
The distinct peaks and bottoms of the MACD histogram allow identifying divergences with high accuracy. It’s important to understand that one should look for divergences when there are signs of the trend ending produced by other analysis methods. When there are pullbacks and flat trends, the signals of this type are inefficient.
There are many trading strategies that use a combination of the MACD indicator with other tools.
For example, the MACD divergence signaling the trend change allows closing existing position and using
other indicators to look for an entry point in the opposite direction.
Good results have been demonstrated by the strategies combining the MACD with the resistance and support
levels for smaller timeframes.
A classical method is a combination of the MACD with a trend indicator and an oscillator, the simplest
one being the combination of the MACD with the Moving Average indicator and the RSI oscillator.
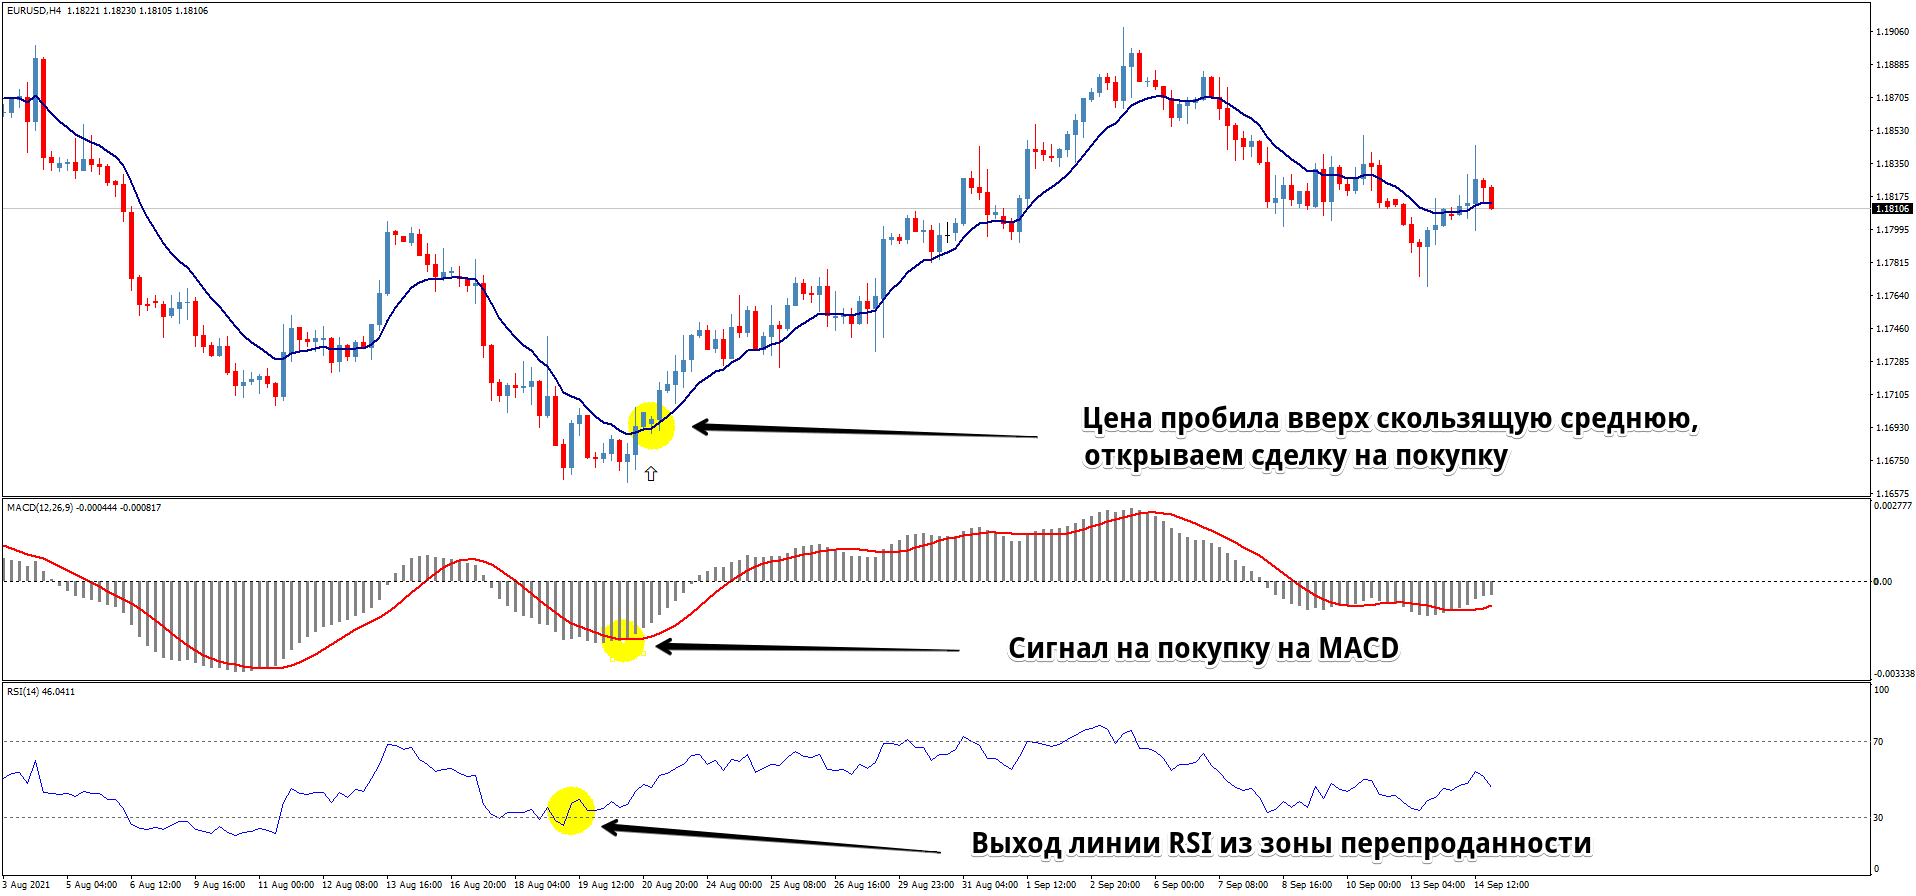
[The price breaks above the moving average, open a buy trade;
A buy signal on the MACD;
The RSI line leaves the oversold zone]
Figure 7. Combining the MACD, Moving Average and RSI indicators
The entry rules of such trading strategy are quite simple:
In such a combination the indicators efficiently complement each other, decreasing the number of losing entry signals. Another advantage of this combination is that it allows opening a position in the very beginning of a trend so that its profits would significantly compensate the losses from false entries.
One of the major advantages of the MACD is its combination of the elements of a trend indicator and an oscillator. As a trend tool, one can expect that the MACD signals would have quite high accuracy. Using moving averages ensures that the indicator will follow an asset’s price. Since the MACD uses exponential moving averages, the inevitable indicator lag is reduced to minimum.
Another strength of the MACD is its
double smoothing.
It is achieved by using moving averages which are already smoothed out as well as by using the
difference. Smoothing allows identifying an asset price’s general direction while ignoring the price
noise.
As an oscillator, the MACD is the most efficient tool for predicting the current trend change. The
presence of a divergence signals to a trader that positions in the trend direction should be partially
or fully closed and that one should also look for possibilities for entering trades when the trend
breaks.
Although using exponential moving averages allowed reducing signal lag, it is still present in the MACD.
It isn’t particularly negative for trend trading because it filters out noise and false price movements,
but for scalping and intraday trading this trading signal lag level is often critical.
While the MACD efficiency is high when identifying divergences, it is low when dealing with overbought
and oversold levels. One can visually identify historical extremes of the histogram and take them for
overbought and oversold levels; however, although the indicator settings allow fixing a high and a low
at a certain level, there are no distinct boundaries limiting the histogram movement up or down in the
MACD indicator.
The difference between the fast and slow moving averages that lies at the basis of the MACD indicator is
not relative, but absolute. When an asset’s price rises, the difference between the two moving averages
also rises, no matter if it’s positive or negative. This makes it significantly more difficult to apply
additional levels to the MACD indicator for long-term, especially when the asset price increase was
exponential.
Thanks to combining properties intrinsic to both trend indicators and oscillators, the MACD indicator is
a universal tool with very flexible use cases for trading on any financial markets.
The MACD indicator and its modifications are the basis for a huge number of trading strategies. However,
its use as a self-contained signal source without using additional filtering tools would hardly be
efficient and could lead to losses. Any market signals need to be confirmed.
Combining the MACD with several properly chosen indicators would be a good strategy with a reasonable
ratio of winning and losing trades ensuring steady profits.
or